In today’s post, we’re exploring SuzieQ, an open-source network observability platform that’s making waves in the way we monitor and understand our networks. It supports a wide array of devices from top vendors like Arista, Cisco, and Juniper, among others. We’ll start with the fundamentals and finish with a practical example to clearly illustrate how SuzieQ sets itself apart from other automation tools.
What We Will Cover?
- What exactly is SuzieQ?
- How does SuzieQ work?
- How to install SuzieQ?
- SuzieQ terminology (Configuration, Inventory, suzieq-cli, poller)
- Configuration and Inventory files
- Examples using OSPF Topology
- Path Analysis
What Exactly is SuzieQ?
I first came across SuzieQ a while back but didn't dive deep into it because tools like Netmiko or Napalm were fitting my needs just fine. That changed when I tuned into a recent Packet Pushers podcast featuring Dinesh Dutt, the brain behind SuzieQ. Hearing him talk about it got me really interested.
After the podcast, I couldn't hold back from giving SuzieQ a try. There have been many times when I found myself writing custom scripts to get things done, only to discover that SuzieQ could have handled those tasks much more smoothly.
So, what is SuzieQ? In simple terms, it's a tool designed to help us understand and troubleshoot our networks better. It gathers and analyzes data from a variety of network devices, making it easier to see what's happening across our infrastructure without needing to craft individual scripts for common tasks.
SuzieQ is the first open source, multi-vendor network observability platform application. It is both a framework and an application using that framework, that is focused on improving your understanding of your network. We define observability as the ability of a system to answer either trivial or complex questions that you pose as you go about operating your network. How easily you can answer your questions is a measure of how good the system's observability is. A good observable system goes well beyond what is normally considered monitoring and alerting. SuzieQ is primarily meant for use by network engineers and designers.
How does SuzieQ work?
You start by giving SuzieQ read-only access to all your network devices. What SuzieQ does next is pretty clever. It runs a variety of "show" commands across these devices to gather a comprehensive picture of your network's state and health.
Once SuzieQ has this information, you can ask it all sorts of questions. For instance, you might want to know which ports are assigned to VLAN 50, find the path between two IP addresses, or identify which ports went down in the last 10 minutes.
This approach sets SuzieQ apart from other automation tools like Netmiko or Napalm. While these tools are great at interacting with individual devices, they see each device as its own entity and don't really connect the dots between them. SuzieQ, on the other hand, not only collects data from each device but also understands the relationships and dependencies between them, giving you a more integrated view of your network's operation.
How to install SuzieQ?
Installing SuzieQ is straightforward and can be done in a couple of ways. You can either use a Docker container or go the Python route with pip. For the sake of this example, I'll show you how to do it using pip. Keep in mind, SuzieQ needs Python 3.8.1 or newer.
I always suggest using a Python virtual environment for such installations. It helps keep your projects and their dependencies neatly organized and separate from each other. I’m doing this setup on my Mac, but the process is pretty much the same regardless of the operating system you're using.
First, I created a new folder named suzieq_project. Then, I set up a Python virtual environment inside this folder. If you're following along, open your terminal, navigate to the working directory and run these commands.
python -m venv venv
source venv/bin/activate
This sets up a new virtual environment called venv and activates it. Once you're in your activated virtual environment, installing SuzieQ is as easy as running the pip command.
pip install suzieqAnd that's it. You've successfully installed SuzieQ on your system, and you're ready to start exploring what it can do for your network.
SuzieQ Terminology
Before diving into SuzieQ, it's crucial to get familiar with a couple of terms and components that are fundamental to its operation. Essentially, to get SuzieQ up and running effectively, you need two key files, a configuration file and an inventory file. If you've worked with Ansible before, you can think of these files as SuzieQ's equivalent to Ansible's ansible.cfg and the inventory file. Both of SuzieQ's files are written in YAML format, which is straightforward and easy to understand.
Configuration File
The configuration file in SuzieQ is where you define the settings that control how SuzieQ behaves and interacts with your network. This includes specifying the location of your inventory file, defining the output formats for your data, and other operational parameters that SuzieQ uses to perform its tasks.
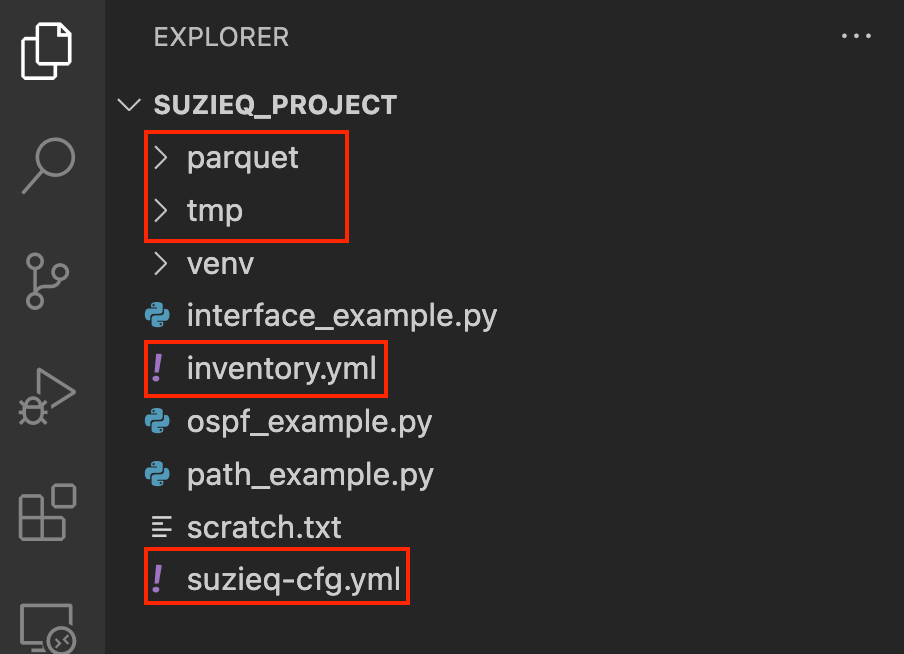
Here is my directory structure (ignore the files that are not highlighted) and the sample configuration file that I created in the current working directory.
#suzieq-cfg.yml

data-directory: ./parquet
temp-directory: ./tmp/

rest:
  API_KEY: 496257e6e86af7f3d6ecb24a6f6d847b224a
  logging-level: WARNING
  address: 127.0.0.1
  port: 8000

poller:
  logging-level: DEBUG
  period: 30
  connect-timeout: 15
  logfile: ./tmp/sq-poller.log
  max-cmd-pipeline: 1
  inventory-file: ./inventory.yml
  chunker:
    policy: sequential

coalescer:
  period: 1h
  logging-level: WARNING

analyzer:
 timezone: Europe/London
You can find detailed information about each configuration option here.
Inventory File
The inventory file is where you list all the network devices that SuzieQ will monitor and gather data from. For each device, you'll include details such as the device type, its hostname or IP address, and the credentials SuzieQ should use to access the device. This file essentially tells SuzieQ, "Here are the devices in my network, and here's how you can connect to them." SuzieQ can get the device information from various sources such as NetBox but in the example, I'm defining them directly in the inventory file.
The new inventory is structured in 4 major pieces, explained in its own section:
- sources - a list of sources to gather the list of devices
- devices - a list of default settings to be applied in case it is not possible to deduce them from the sources
- auths - a list of credential sources
- namespaces - where you put together all the above. A namespace is defined by a source, an auth and a device
#inventory.yml

sources:
  - name: test_devices
    hosts:
      - url: ssh://10.10.50.31
      - url: ssh://10.10.50.32
      - url: ssh://10.10.50.33
      - url: ssh://10.10.50.34
      - url: ssh://10.10.50.35
      - url: ssh://10.10.50.36

devices:
  - name: default_settings
    transport: ssh
    port: 22
    ignore-known-hosts: true

auths:
  - name: default_creds
    username: admin
    password: plain:Cisco123

namespaces:
  - name: my_ns
    source: test_devices
    device: default_settings
    auth: default_creds
The inventory file you're looking at serves as a map for SuzieQ, detailing what devices it should monitor and how to access them. It lists six devices, all of which are accessible via SSH. These devices are grouped under the sources section, each with a unique entry corresponding to their IP addresses.
In the devices section, the file specifies a default setting named default_settings that applies to all devices. This includes using SSH as the transport protocol, the standard port 22 for SSH connections.
The credentials needed to access these devices are neatly outlined in the auths section. Here, a single set of credentials (default_creds) is defined, using a username (admin) and a password (Cisco123).
Finally, the namespaces section ties everything together. It creates a namespace called my_ns, which is essentially a logical grouping of devices. This namespace references the test_devices source for its device list, uses the default_settings for device access parameters, and applies the default_creds for authentication.
Poller
The poller is another key component in SuzieQ that does the heavy lifting of gathering data from your network devices. Think of it as a diligent worker that constantly goes around asking each device for its current state and information. The poller uses the details you provided in the inventory file to connect to each device and execute a series of "show" commands or use APIs to collect data about the network's status and configurations. Once the poller collects this data, it organizes and stores it in a structured normalized format.
To start the poller, you can run the command sq-poller from your current directory.
Suzieq-cli
The SuzieQ CLI is a powerful command-line tool that gives you direct access to SuzieQ's network observability functions. It's designed to query and analyze the network's state and performance easily.
With the CLI, you can ask detailed questions about your network, like checking the status of interfaces, examining routing paths, or identifying configuration inconsistencies across devices. It simplifies the process of pulling complex network data, making it accessible through straightforward commands. To access the CLI, run the command suzieq-cli from your current working directory.
Recap
Here's a quick rundown of the steps we've taken so far.
- We installed SuzieQ using pip, ensuring that we're working with Python version 3.8.1 or newer.
- We created a dedicated directory named
suzieq_projectfor our project. - Inside
suzieq_project, we created two files, the configuration file and the inventory file. These files are essential for SuzieQ to understand our network setup and how to interact with our devices. - We also made two directories within
suzieq_projectcalledparquetandtmp.parquetis used by SuzieQ for storing the data it collects in a structured format, whiletmpholds temporary files and logs that SuzieQ generates during its operation. - To kick things off and start collecting data from our network devices, we initiated the poller by running the
sq-pollercommand. This starts the process of SuzieQ polling our devices, gathering data, and storing it in theparquetdirectory. - Finally, to interact with SuzieQ and see what it has collected, we launched the SuzieQ CLI tool by running
suzieq-cli. This command-line interface allows us to run various commands to query the collected data, check the status of our devices, and perform analyses.
SuzieQ example
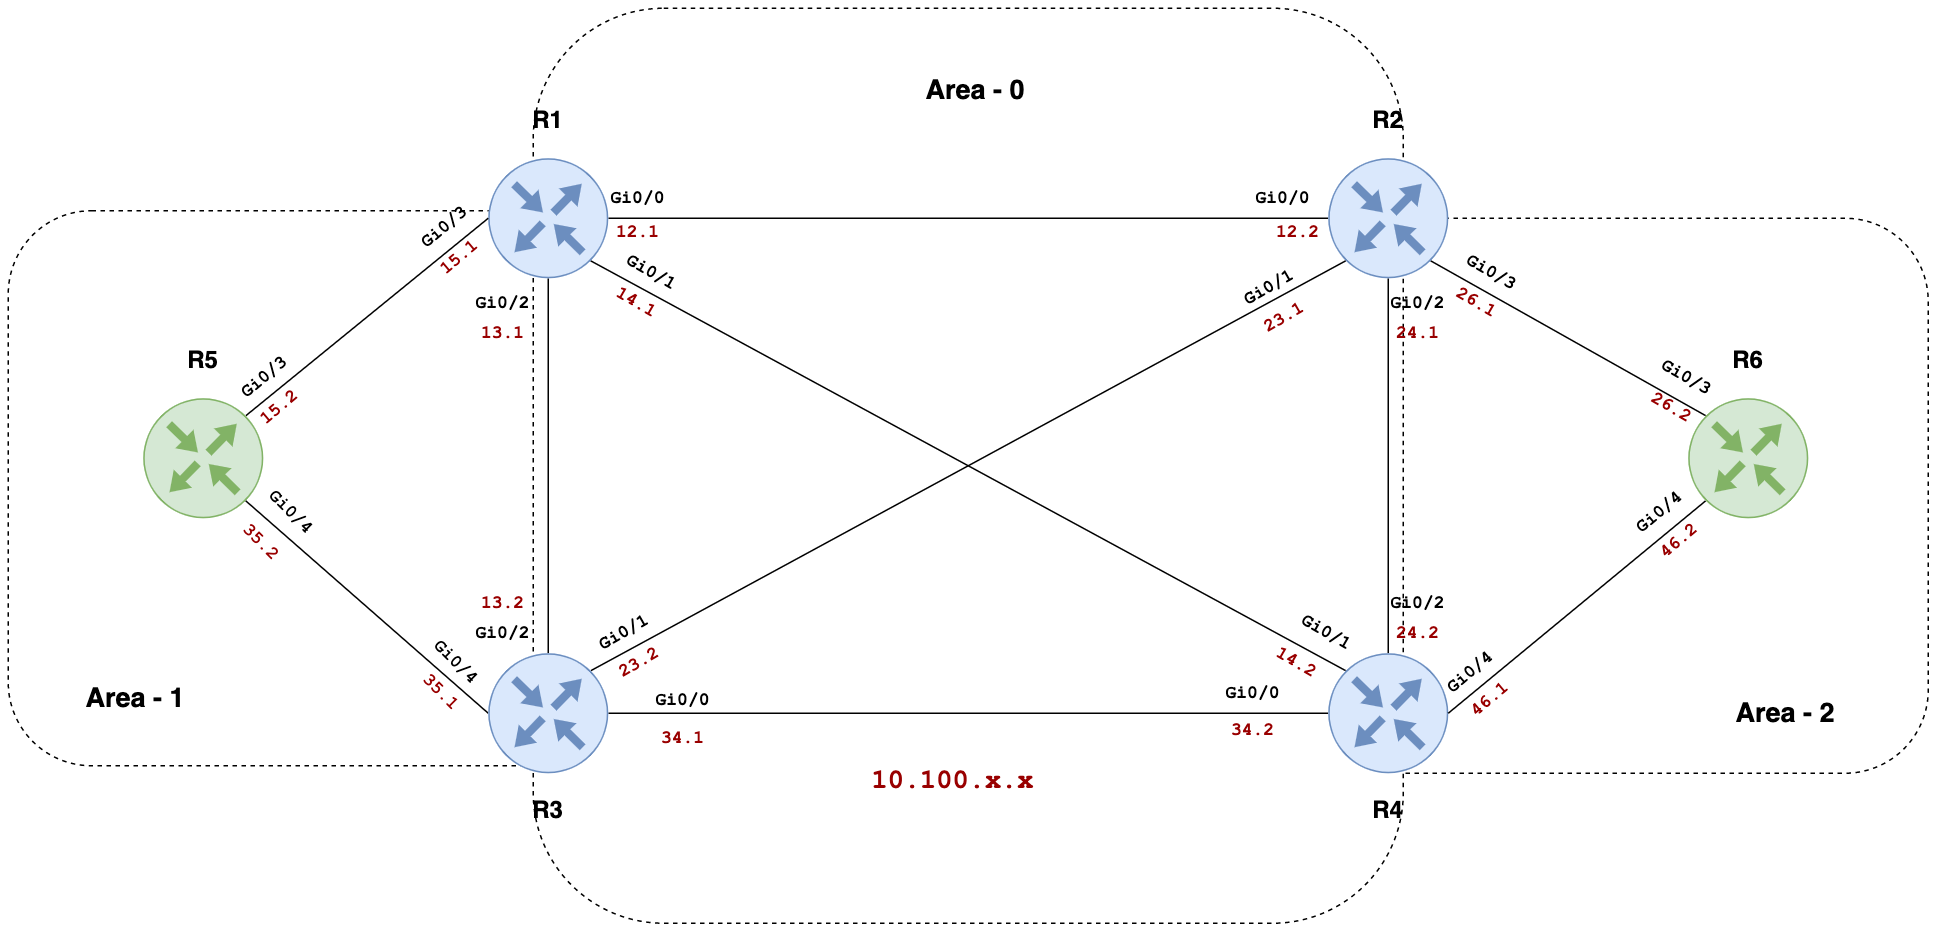
In this example, we're diving into a network with six Cisco routers configured in an OSPF topology. The first step is to ensure SuzieQ is correctly set up to communicate with these devices and gather data from them.
Once you're in the directory where you've got SuzieQ installed, launch the CLI tool by running the suzieq-cli command. This opens up the command-line interface where you can directly interact with SuzieQ. To check if SuzieQ can see and interact with the devices, we use the device show command. This command gives us a snapshot of the devices from the perspective of SuzieQ. Here's what the output looks like.
sureshv> device show
  namespace   hostname model version vendor           serialNumber status      address           bootupTimestamp
0     my_ns  router_01  IOSv          Cisco  94BJ1BEQ4LRBDT4UH6GWD  alive  10.10.50.31 2024-02-23 11:55:30+00:00
1     my_ns  router_02  IOSv          Cisco  9CB0RLV6QQCOFYTLECJA3  alive  10.10.50.32 2024-02-23 11:55:29+00:00
2     my_ns  router_03  IOSv          Cisco  99CPH7XAH8ZVZHLLSGUMB  alive  10.10.50.33 2024-02-23 13:01:26+00:00
3     my_ns  router_04  IOSv          Cisco  9BPHNSK2FJKNN5FK0EF5K  alive  10.10.50.34 2024-02-23 13:01:30+00:00
4     my_ns  router_05  IOSv          Cisco  9Z05HZ0UBNV0X6BWFOHRH  alive  10.10.50.35 2024-02-23 13:00:27+00:00
5     my_ns  router_06  IOSv          Cisco  9SWCPKJPLU9MFK7LV5SN4  alive  10.10.50.36 2024-02-23 12:40:28+00:00
Seeing the status alive next to each router is a great sign. It means that SuzieQ is successfully polling these devices, and they're responding as expected. If you run into any issues or something doesn't seem right, a good place to check is the tmp directory for logs.
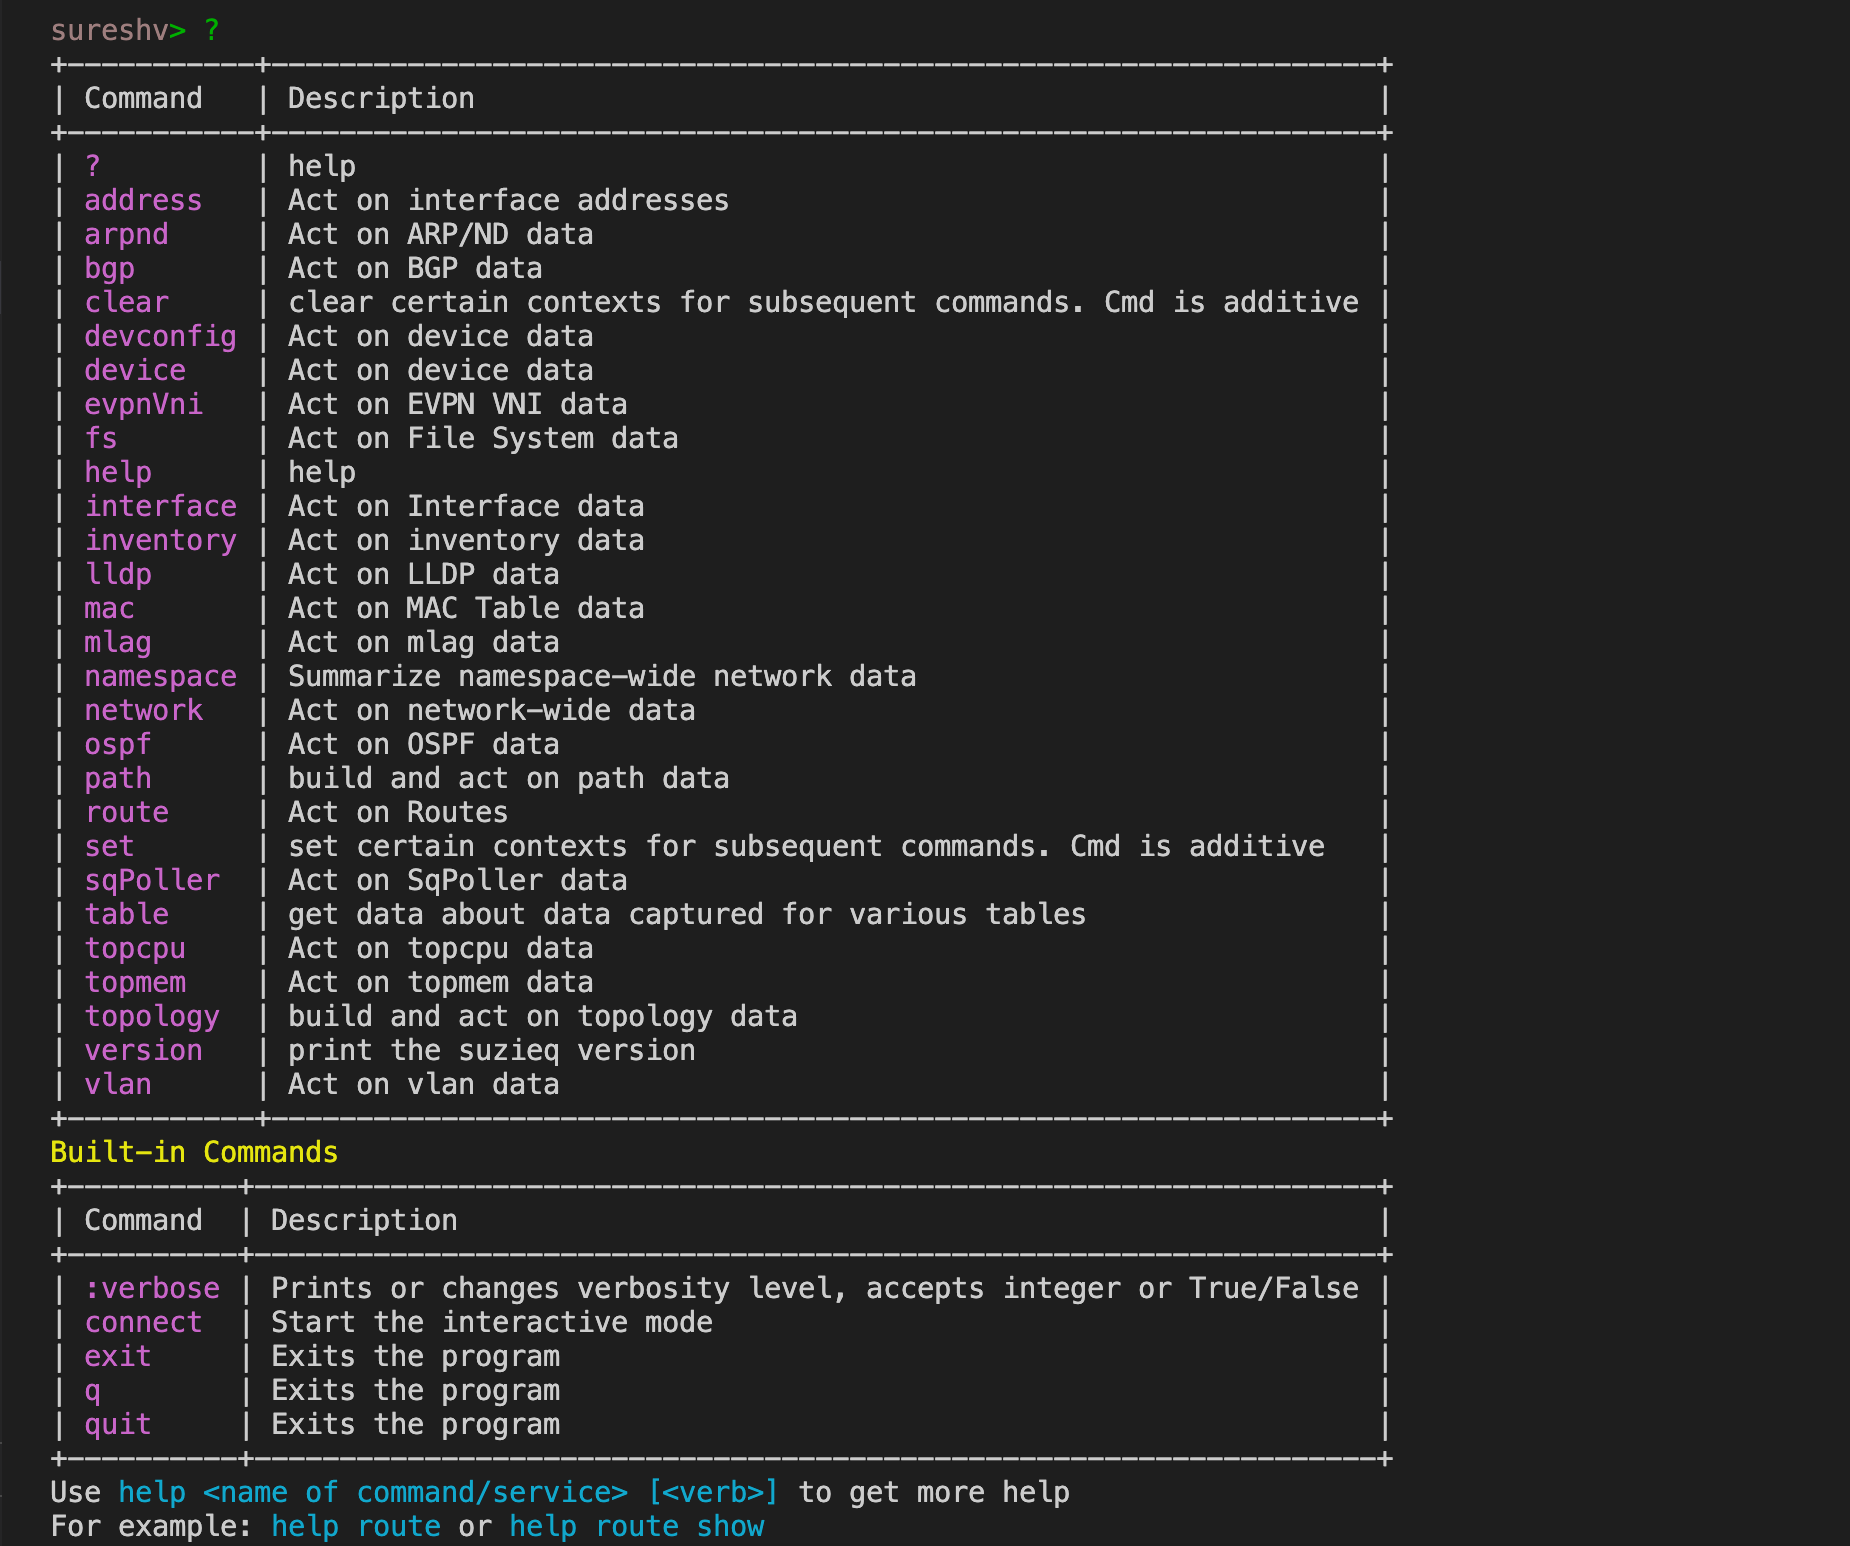
If you type ? on the CLI, it will tell you the available commands to run as shown below.
To kick things off, particularly around OSPF area 2, we turn to SuzieQ for insights. With SuzieQ's comprehensive view of the network, we can easily pull up OSPF details for area 2 with a simple command.After entering ospf show area='0.0.0.2' in the SuzieQ CLI, we get a detailed snapshot of OSPF relationships in this specific area.
sureshv> ospf show area='0.0.0.2' columns='hostname ifname peerHostname area ifState adjState peerIP'
    hostname              ifname peerHostname     area ifState adjState       peerIP
0  router_02  GigabitEthernet0/3    router_06  0.0.0.2      up     full  10.100.26.2
1  router_04  GigabitEthernet0/4    router_06  0.0.0.2      up     full  10.100.46.2
2  router_06  GigabitEthernet0/3    router_02  0.0.0.2      up     full  10.100.26.1
3  router_06  GigabitEthernet0/4    router_04  0.0.0.2      up     full  10.100.46.1
4  router_06           Loopback0               0.0.0.2      up  passive
The command ospf show area='0.0.0.2' columns='hostname ifname peerHostname area ifState adjState peerIP' is a straightforward way to pull specific OSPF information about area 0.0.0.2.
- ospf show - tells SuzieQ to display OSPF-related data.
- area='0.0.0.2' - Filters the information to show only the data related to OSPF area 0.0.0.2.
- columns='...' - Specifies the columns to display in the output
The output shows us connections between routers 02, 04, and 06. Each row in the output details the OSPF interface, the peer router it's connected to, the OSPF area, interface state, neighbor count, adjacency state and peer IP.
routers 02 and 04 are both connected to router 06 within OSPF area 2, with their interfaces up and running in a full adjacency state. The Loopback0 interface on router 06 is also part of area 2 but in a passive state, meaning it participates in OSPF without forming adjacencies.
SuzieQ for Network Troubleshooting
Let's dive into a scenario where our network was running without issues until about 10 minutes ago, when suddenly, users started reporting problems and we want to find out what went wrong. To simulate a network failure for this example, I shut the link between R2 and R6 (GigabitEthernet0/3)
router_02(config)#interface GigabitEthernet0/3
router_02(config-if)#shut
After performing the shutdown, I gave it 30 seconds—enough time for our polling period to capture the change—and then jumped back into suzieq-cli to see if SuzieQ could pinpoint the problem. My goal was to use SuzieQ to identify any OSPF issues that occurred within the last 10 minutes, which covers the period before and after I shut down the interface.

Perfect, exactly what we wanted to see 😊 The output says the link Gi0/3 is down on router_02
Identifying the Path
Another useful thing to do is path lookup. I've set up a loopback address on each router, with R1 having 1.1.1.1, R2 with 2.2.2.2, and so on. Suppose I want to find the path from 1.1.1.1 to 6.6.6.6. Let's ask SuzieQ for help. Here's the command I used.
path show src='1.1.1.1' dest='6.6.6.6' namespace=my_ns columns='pathid iif ipLookup nexthopIp hostname oif protocol'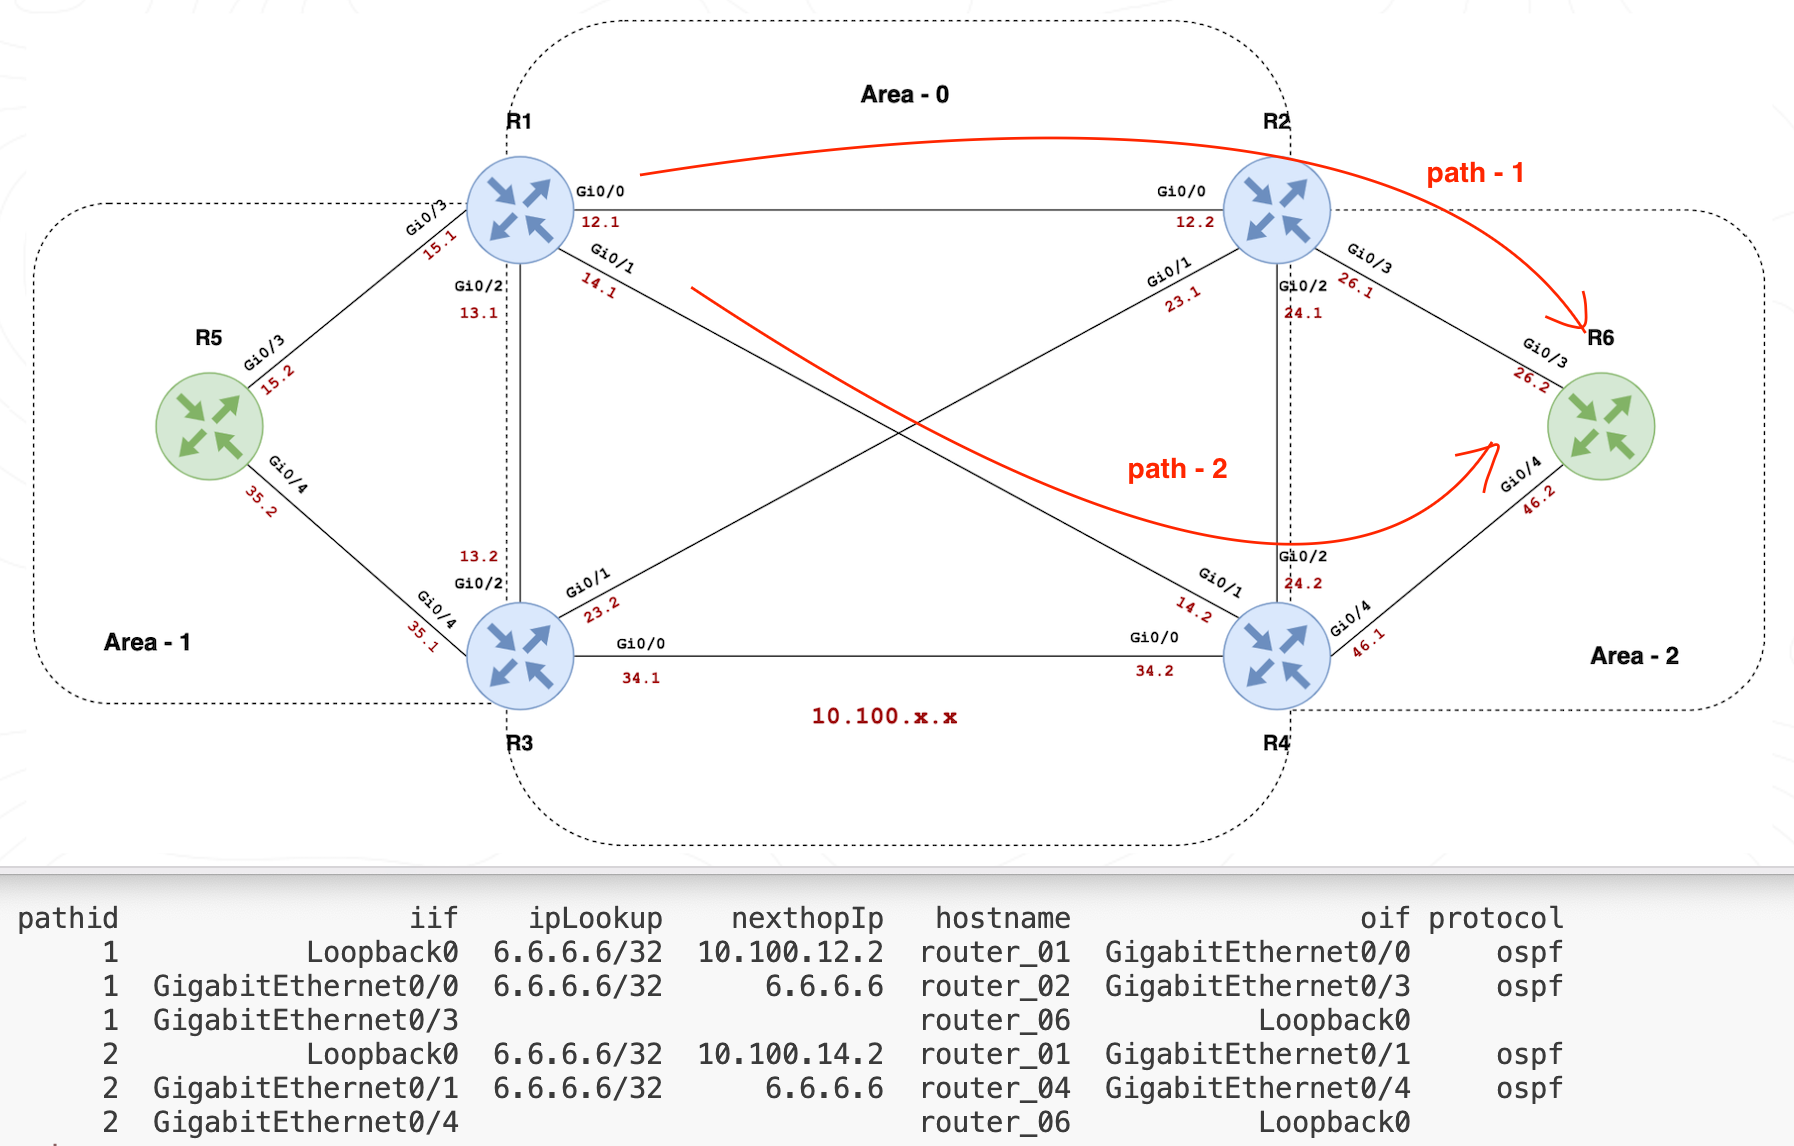
And here's what SuzieQ told us.
- The first path starts from R1's loopback, goes through its
GigabitEthernet0/0, hops to R2, and then straight to R6. - The second path also begins at R1 but takes a different route through
GigabitEthernet0/1, moving to R4, and finally reaches R6.
Both paths are managed by OSPF, showing us alternative routes for our data packets. This quick lookup is super handy for spotting how traffic flows through our network, especially useful when troubleshooting or planning changes.
SuzieQ Python API
SuzieQ doesn't just stop at the command line interface, it also offers a Python API that opens up a world of possibilities for automating network analysis tasks. Instead of typing out commands in the CLI, you can write Python scripts to do the job programmatically. This means you can integrate SuzieQ into your existing Python projects or workflows, making it super flexible for various use cases. Here are some quick examples to show you how it's done.
Fetching OSPF data - You can easily grab OSPF information for a specific router, like router_01, and print it out. (The output is similar to what you will get it using the CLI)
from suzieq.sqobjects import get_sqobject

ospf_tbl = get_sqobject('ospf')
ospf_df = ospf_tbl().get(hostname='router_01')

print(ospf_df)
Checking interface details - Similarly, you can get details about the interfaces on router_01 with just a few lines of code.
from suzieq.sqobjects import get_sqobject

interface_tbl = get_sqobject('interface')
interface_df = interface_tbl().get(hostname='router_01')

print(interface_df)
Path analysis - Want to find the path between two IP addresses within your network? There's a straightforward script for that too, which lets you specify source, destination, and additional parameters to get exactly the information you need.
from suzieq.sqobjects import get_sqobject

path_tbl = get_sqobject('path')
path_df = path_tbl().get(src='1.1.1.1', dest='6.6.6.6', namespace=['my_ns'], columns=['hostname', 'pathid', 'iif', 'ipLookup', 'nexthopIp', 'oif', 'protocol'])

print(path_df)
#output
hostname pathid iif ipLookup nexthopIp oif protocol
0 router_01 1 Loopback0 6.6.6.6/32 10.100.12.2 GigabitEthernet0/0 ospf
1 router_02 1 GigabitEthernet0/0 6.6.6.6/32 6.6.6.6 GigabitEthernet0/3 ospf
2 router_06 1 GigabitEthernet0/3 Loopback0
3 router_01 2 Loopback0 6.6.6.6/32 10.100.14.2 GigabitEthernet0/1 ospf
4 router_04 2 GigabitEthernet0/1 6.6.6.6/32 6.6.6.6 GigabitEthernet0/4 ospf
5 router_06 2 GigabitEthernet0/4 Loopback0 Closing Up
To wrap up, we've only scratched the surface of what SuzieQ can do for network analysis and troubleshooting. There's a lot more you can explore, and if you're eager to dive deeper, SuzieQ has a comprehensive guide on their website that's definitely worth checking out. I hope this post gives you a good starting point to get going with your own network troubleshooting adventures using SuzieQ. Happy networking.